By The Numbers
How Does Instagram's Algorithm Actually Work?
Find out the secret behind Instagram success based on real numbers.
An archive of every article. Use the category filters and search bar to find exactly what you're looking for.
By The Numbers
Find out the secret behind Instagram success based on real numbers.
The Learning Curve
A stats hack game. Learn how to guess the correlation coefficient (r) just by looking at a scatterplot?
The Learning Curve
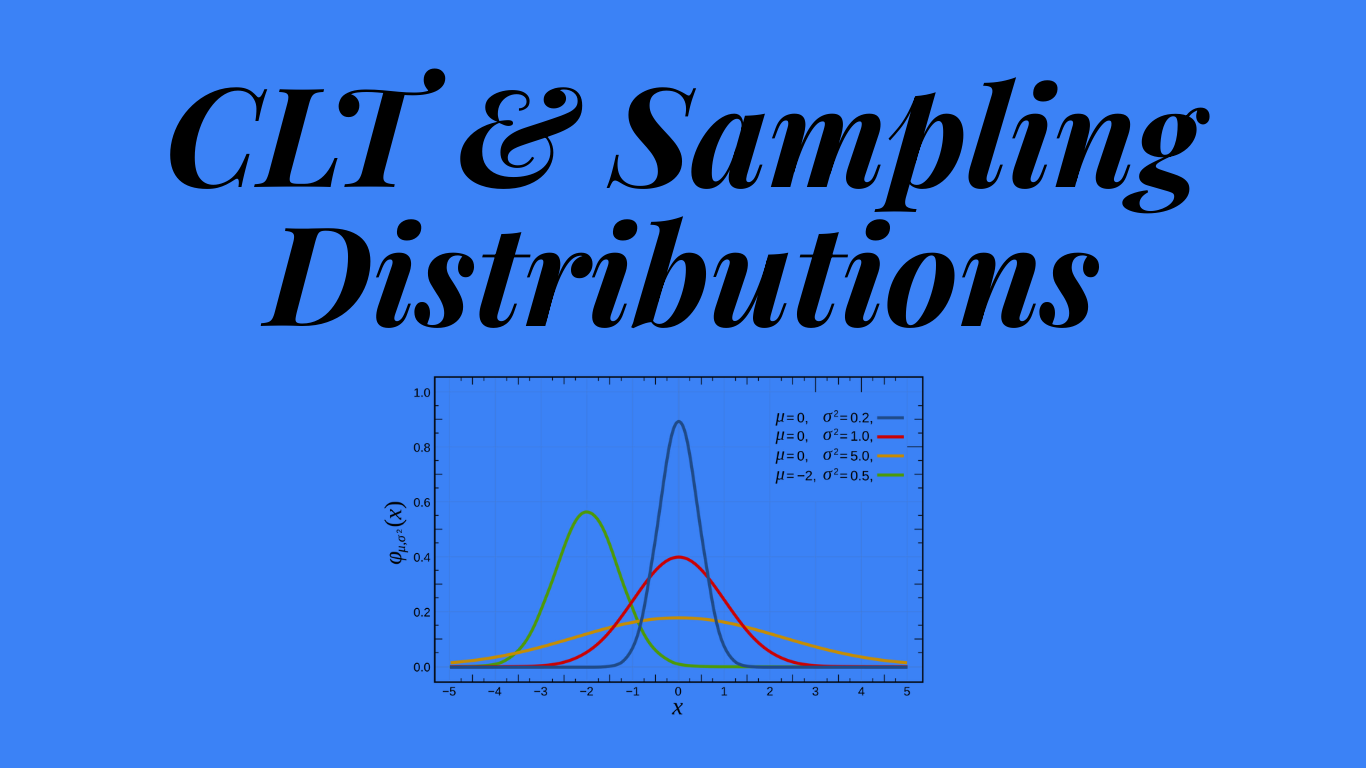
Learn how the Central Limit Theorem allows us to make inferences about populations using sample data, and understand the concept of sampling distributions.
The Learning Curve
Explore the building blocks of uncertainty with probability distributions, and see how they model real-world phenomena.
The Learning Curve
Learn why we can predict the future (even when we can't predict the next coin flip). A guide to probability, randomness, and the logic of inference.
The Learning Curve
Learn about the relationship between two variables, and how your choices pair up without you noticing.
The Learning Curve
Discover how and why so much of your life clusters around the average, from heights to test scores.
Mean Girls (& Median)
A statistical analysis that is so fetch, analysing why Taylor Swift fans create a perfect bell curve with concert ticket prices.
By the Numbers
Discover why ChatGPT's massive userbase does not necessarily equal success in the enterprise market.
Inference
Simplifying the confusion behind science's most essential, yet misunderstood number.
The Learning Curve
Why the 'typical' value can be deceiving and how to choose between averages. Additionally, learn about spread.
The Learning Curve
Dive into the very core concepts of what makes statistics tick.